A statistical insight

I’ve been working during the weekends on an instrumentation frontend to precisely measure the resistance of an RTD sensor using a ratiometric approach.

After building it and waiting a prudential time to let it warm I saved an hour of samples (3600) and fired Octave.

The mean and standard deviation looked ok and while a plot showed a bit of noise it was well within reasonable limits.

Just for the sake of it I did a histogram and, oh the horror:

This is clearly not OK. It should be more like a Gaussian (the real formula is quite daunting but still retains symmetry) and that looks a lot like a bimodal distribution. Changing the number of bins does not help.

The ADC I used does not have a reference input so I make two differential reads and then take the quotient (I know… but it was the only one available when started).

Perhaps the input multiplexer is at fault? (the unused channels are grounded, so I discarded that as a cause). I repeated the experiment but this time doing a full run on each channel instead of switching them and this is the result:
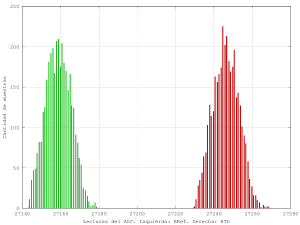
Well, both are skewed so there’s something else going on.

Scoping at the inputs shows what seems to be AM at around 70MHz even without power applied (that’s on the tv broadcast band here) and it kind of makes sense because I didn’t use a shield. Head bangs on the desk.

Anyways, using a quick digital filter makes everything look nicer but I’ll still have to shield this:

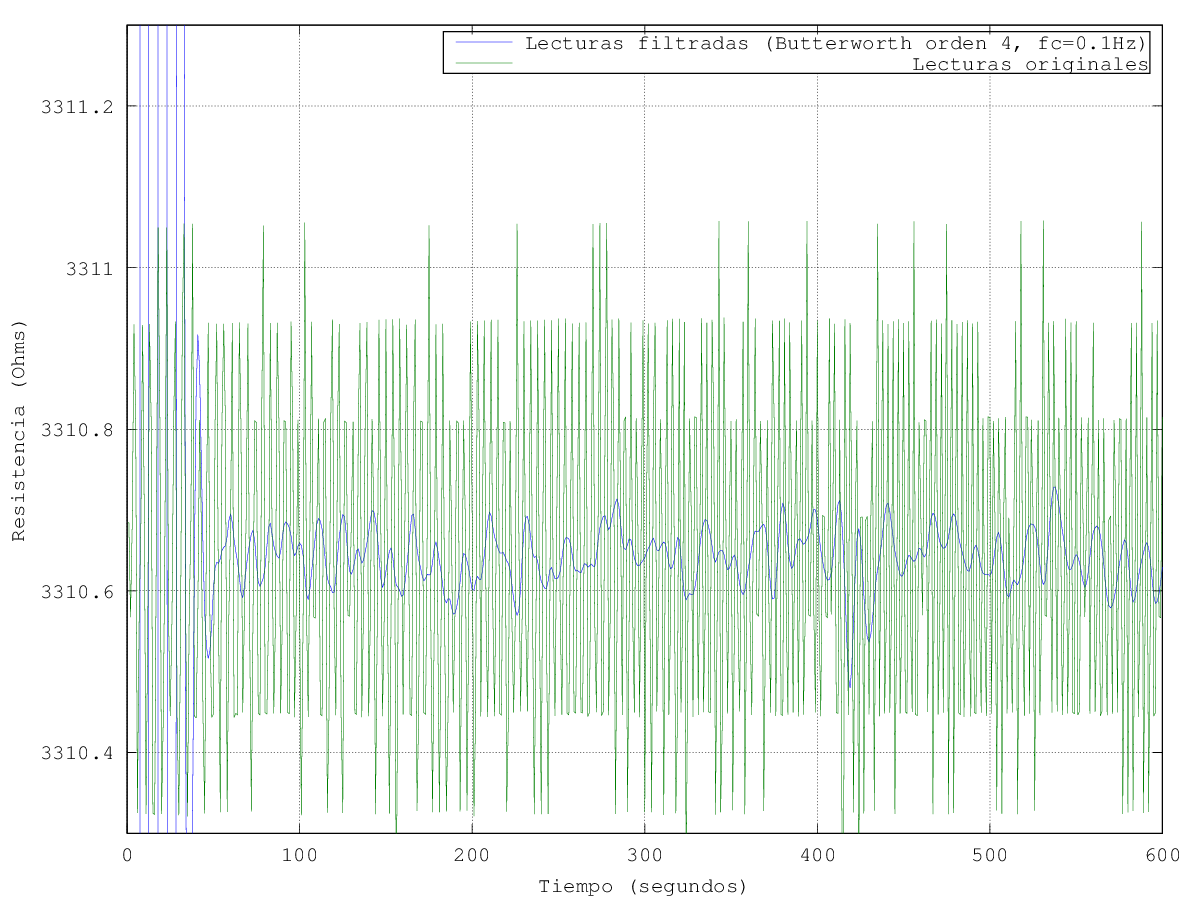
The transient at the beginning is not going to be an issue, as in real life I don’t expect such a step change (from 0 to ~3k) and in any case the antialias filter will get rid of it.

On a second thought, those chunks skewed up are really interesting and I should spotted that as a failure symptom earlier.

(trying to) Measure temperature

In a while I’ll need to characterize an oven and perhaps build a new one.
Just to start I have to apply a power step and measure how the internal temperature evolves.

In order to save time I searched my local distributors and bought a K type thermocouple with amplifier and cold junction compensation. It is not the most accurate but it is more than enough for now. There are a couple of ics available that give a direct digital output but the work needed to breadboard them and have a meaningful reading is beyond the scope at this stage.

This is what I bought:

Appears on many places as a “Grove High Temperature Sensor”. It sports an OPA333 precision opamp and a CJ432 adjusted to provide a 1.5V reference. The rest of the circuit is nothing special, except that the manufacturer called the thermistor “light”. It can be consulted here.

First ligths

While I have more capable hardware at hand I grabbed an Arduino Nano and the official library from https://github.com/Seeed-Studio/Grove_HighTemp_Sensor and lo and behold I had it streaming temperature to my terminal.

Let’s get graphical

I cooked a simple gui on python using Qt and Qwt while listening to Olivia Newton.
It is pretty barebones, only has facilities to export into csv, a couple of tracking cursors and gracefully handles device disconnections (say, I yank the cable). I expect to post process the data using QtiPlot or Kst.

Tweaking

One of the first things I noted was that the measured temperature jumped in big steps of about 2°C.
Using the default setup with a 5V “reference” and considering the amplifier gain every adc bit amounts to:

 Vbit = \frac{5000mV}{1023*54.16} = 0.09024 mV

Looking at the polynomial coefficients used by the library (ITS90) and taking a first order approximation one bit corresponds to a 2.26°C step and it grows bigger with the measured temperature as other terms start to influence the result. Even tough the output is low pass filtered at about 1.6KHz and it is averaged over 32 points there’s still noise.

Changing the reference to use the regulated 3.3V makes it about 1.5°C but even if it is more than enough for what I need it can be better.

With a couple of bits more I can achieve better resolution. Instead of using an external adc I took advantage of the inherent noise on the reference and output and chose to apply a 16 times oversample in order to have 12 bits out of the 10 bit adc. Application note AVR121 explains that nicely. Now I am limited (in theory…) to 0.37°C steps and I can average on top of that to further reduce variations.

The last source of error (besides not knowing for sure the “real” value of the references) is that the library assumes a fixed 350mV output, the circuit ideally floats the amplified thermocouple voltage around that. In order to measure it I added a small relay from my stash (TQ2SA-5V) to short the input. It is not meant to be used as a dry relay but does fine so far.
Upon startup it reads 348 mV; while a 2mV difference may not seem that big it turns out to be at least 185m°C. Anyway the main sources of error now are the thermocouple and adc reference.