I’ve been working during the weekends on an instrumentation frontend to precisely measure the resistance of an RTD sensor using a ratiometric approach.
After building it and waiting a prudential time to let it warm I saved an hour of samples (3600) and fired Octave.
The mean and standard deviation looked ok and while a plot showed a bit of noise it was well within reasonable limits.
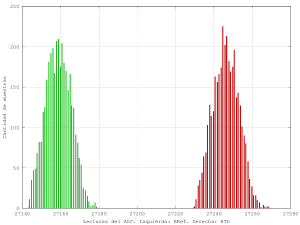
Just for the sake of it I did a histogram and, oh the horror:
-

-
Histogram of readings.
This is clearly not OK. It should be more like a Gaussian (the real formula is quite daunting but still retains symmetry) and that looks a lot like a bimodal distribution. Changing the number of bins does not help.
The ADC I used does not have a reference input so I make two differential reads and then take the quotient (I know… but it was the only one available when started).
Perhaps the input multiplexer is at fault? (the unused channels are grounded, so I discarded that as a cause). I repeated the experiment but this time doing a full run on each channel instead of switching them and this is the result:
-

-
Histogram of raw samples taken at different times to avoid using the multiplexer.
Well, both are skewed so there’s something else going on.
Scoping at the inputs shows what seems to be AM at around 70MHz even without power applied (that’s on the tv broadcast band here) and it kind of makes sense because I didn’t use a shield. Head bangs on the desk.
Anyways, using a quick digital filter makes everything look nicer but I’ll still have to shield this:
-

-
Measured resistance with and without filtering.
The transient at the beginning is not going to be an issue, as in real life I don’t expect such a step change (from 0 to ~3k) and in any case the antialias filter will get rid of it.
On a second thought, those chunks skewed up are really interesting and I should spotted that as a failure symptom earlier.


