Latest geek reads

Some of the things I’ve read/watched lately to sharpen my skills:

Hey, I wrote an assembler.

(It was about time I interrupted a never ending pile of drafts with something)

So, for a bit more than a month I’ve been attending a seminar on VHDL microcontroller design.

One of the workshops involved doing some simple exercises on eval boards. While the overall instruction set is small (fits on less than a page) the idea of programming and then assembling the sources using pencil and paper wasn’t very appealing at the moment.

It sure is a fun way to keep the mind fresh but given time constraints I couldn’t cope with such a long debugging cycle.

And… The obvious path was to build a tool.

I reused parts of python-lx200 because smart data structures and dumb code are nice. Most of this could be implemented with M4 too, perhaps for another code golf session.

A couple of years ago I’d probably tried to use Bison and Flex but doubt that I could manage something like this in just a handful of hours during the weekend.

There are some rough edges but as it is it supports labels, variable definitions and emits a valid IHEX file. I made a couple of dumb mistakes but they were really evident when looking at what Quartus made of the output file.

I’m quite proud of the result, I don’t know when was the last time I had so much fun doing a one off project, even if it wouldn’t be used anymore after the seminar.

The source code lives here: https://github.com/pardo-bsso/islyd-asm

Breaking a simple captcha with Python and Pillow

A while ago one of our long time customers approached us to automate tasks on a government portal. At least here most of them are kind of ugly, work on a specific set of browser versions and are painfully slow. We already helped him with problems like this before, so instead of having someone enter manually all the data they just populate a database and then our robot does all the work, simulating the actions on the web portal.

This one is a bit different, because they introduced a captcha in order to infuriate users (seriously, it looks like they don’t want people logging in).

Most of the time they look like this:

The first thing I tried was to remove the lines and feed the result into an ocr engine. So I made a very simple filter using Pillow:


#!/usr/bin/python

from PIL import Image
import sys, os

def filter_lines(src):
    w,h = src.size

    stripes = []
    ss = {}

    for x in range(w):
        count = 0
        for y in range(h):
            if src.getpixel( (x,y) ) != (248, 255, 255):
                count += 1
        if count == h:
            stripes.append(x)

    for x in stripes:
        for y in range(h):
            src.putpixel( (x,y),  (248, 255, 255) )
    return src

if __name__ == '__main__':
    src = Image.open(sys.argv[1])
    region = filter_lines(src)
    region.save(sys.argv[2])

Now it looks better but after trying gocr and tesseract it still needs more work:

Just for kicks I decided to filter 100 images and overlap them, this is what I got:

That is interesting… I used this script (not the most efficient approach, but still..)


#!/usr/bin/python

from PIL import Image
import sys, os

dst = Image.new('RGB', (86, 21) )

w,h = 86, 21

for x in range(w):
    for y in range(h):
        dst.putpixel( (x,y),  (255, 255, 255) )

for idx in range(30):
    src = Image.open('filtradas/%i.bmp'%idx)

    for x in range(w):
        for y in range(h):
            if src.getpixel( (x,y) ) != (248, 255, 255):
                dst.putpixel( (x,y),  (255, 0, 0) )

dst.save('overlapeada.bmp')

With this piece of information I can focus my efforts on that area only.
That font, even distorted, looks quite familiar to me. And indeed it is, it’s Helvetica.
This makes the problem a lot easier.

I grabbed a bitmapped version of the same size and made a grid that shows were can a number land assuming 8×13 symbols:

This shows that there is a slightly overlap between digits.
I went for a brute force approach, dividing the captcha in cells and comparing each one with every digit on the font with a small amount of overlap between them.
The symbols are smaller than the cell, so for every one of them I build regions on the cell and assign a score for the number of pixels that are equal on both.
The one that has a highest score is (likely) the correct number.

This is really simple, event tough we do a lot of comparisons performs ok (the images are quite small), and without tunning we got about 30% success rate (the server also adds noise and more aggressive distortions from time to time).

Have a difficult or non conventional problem? Give us a call, we are like the A-Team of technology.

This is the complete algorithm (it’s in Spanish but shouldn’t be hard to follow), can also be found here: https://gist.github.com/pardo-bsso/a6ab7aa41bad3ca32e30


#!/usr/bin/python

from PIL import Image
import sys, os


imgpatrones = []
pixelpatrones = []

for idx in range(10):
    img = Image.open("patrones/%i.png" % idx).convert('RGB')
    imgpatrones.append(img)
    pixelpatrones.append( list(img.getdata()) )


def compara(region, patron):
    pixels = list(region.getdata())
    size = min(len(pixels), len(patron))

    res = 0.0
    for idx in range(size):
        if pixels[idx] == patron[idx]:
            res = res + 1

    return res / size


def elimina_lineas(src):
    cropeada = src.crop( (4, 1, 49, 19) )
    w,h = cropeada.size
    stripes = []

    for x in range(w):
        count = 0
        for y in range(h):
            if cropeada.getpixel( (x,y) ) != (248, 255, 255):
                count += 1

        if count == h:
            stripes.append(x)

    for x in stripes:
        for y in range(h):
            cropeada.putpixel( (x,y),  (248, 255, 255) )
            cropeada.putpixel( (x,y),  (255, 0, 0) )

    return cropeada

def crear_crops(src, celda):
    limites = range(38)
    xceldas = [0, 8, 16, 24, 32, 40]
    xoffsets = range(-3,4)
    yceldas = range(6)
    boxes = []
    crops = []

    x = xceldas[celda]
    x = [ (x+off) for off in xoffsets if (x+off) in limites ]

    for left in x:
        for top in yceldas:
            boxes.append( (left, top, left+8, top+13) )

    for box in boxes:
        crops.append( src.crop(box) )

    return crops

def compara_crops_con_patron(crops, patron):
    scores = []
    for crop in crops:
        scores.append( compara(crop, pixelpatrones[patron] ))
    return max(scores)

def decodifica_celda(src, celda):
    pesos = []
    crops = crear_crops(src, celda)

    for patron in range(10):
        pesos.append( compara_crops_con_patron(crops, patron) )

    return pesos.index( max(pesos) )

def decodifica(filename):
    original = Image.open(filename)
    src = elimina_lineas(original)
    res = []

    for celda in range(6):
        res.append( decodifica_celda(src, celda) )

    return ''.join( str(x) for x in res )

if __name__ == '__main__':
    print decodifica(sys.argv[1])

(trying to) Measure temperature

In a while I’ll need to characterize an oven and perhaps build a new one.
Just to start I have to apply a power step and measure how the internal temperature evolves.

In order to save time I searched my local distributors and bought a K type thermocouple with amplifier and cold junction compensation. It is not the most accurate but it is more than enough for now. There are a couple of ics available that give a direct digital output but the work needed to breadboard them and have a meaningful reading is beyond the scope at this stage.

This is what I bought:

Appears on many places as a “Grove High Temperature Sensor”. It sports an OPA333 precision opamp and a CJ432 adjusted to provide a 1.5V reference. The rest of the circuit is nothing special, except that the manufacturer called the thermistor “light”. It can be consulted here.

First ligths

While I have more capable hardware at hand I grabbed an Arduino Nano and the official library from https://github.com/Seeed-Studio/Grove_HighTemp_Sensor and lo and behold I had it streaming temperature to my terminal.

Let’s get graphical

I cooked a simple gui on python using Qt and Qwt while listening to Olivia Newton.
It is pretty barebones, only has facilities to export into csv, a couple of tracking cursors and gracefully handles device disconnections (say, I yank the cable). I expect to post process the data using QtiPlot or Kst.

Tweaking

One of the first things I noted was that the measured temperature jumped in big steps of about 2°C.
Using the default setup with a 5V “reference” and considering the amplifier gain every adc bit amounts to:

 Vbit = \frac{5000mV}{1023*54.16} = 0.09024 mV

Looking at the polynomial coefficients used by the library (ITS90) and taking a first order approximation one bit corresponds to a 2.26°C step and it grows bigger with the measured temperature as other terms start to influence the result. Even tough the output is low pass filtered at about 1.6KHz and it is averaged over 32 points there’s still noise.

Changing the reference to use the regulated 3.3V makes it about 1.5°C but even if it is more than enough for what I need it can be better.

With a couple of bits more I can achieve better resolution. Instead of using an external adc I took advantage of the inherent noise on the reference and output and chose to apply a 16 times oversample in order to have 12 bits out of the 10 bit adc. Application note AVR121 explains that nicely. Now I am limited (in theory…) to 0.37°C steps and I can average on top of that to further reduce variations.

The last source of error (besides not knowing for sure the “real” value of the references) is that the library assumes a fixed 350mV output, the circuit ideally floats the amplified thermocouple voltage around that. In order to measure it I added a small relay from my stash (TQ2SA-5V) to short the input. It is not meant to be used as a dry relay but does fine so far.
Upon startup it reads 348 mV; while a 2mV difference may not seem that big it turns out to be at least 185m°C. Anyway the main sources of error now are the thermocouple and adc reference.

Using WebKitGTK as the UI for GStreamer applications.

Lately I’ve been thinking a lot about how can I make nice and easily customizable interfaces for video applications. My idea of ‘nice’ is kind of orthogonal to what most of my expected user base will want, and by ‘easily customizable’ I don’t mean ‘go edit this glade file / json stage / etc’.

Clutter and MX are great to make good looking interfaces and like Gtk have something that resembles css to style stuff and can load an ui from an xml or json file. However, they will need sooner or later a mix developer and a designer. And unless you do something up front, the interface is tied to the backend process that does the heavy video work.

So, seeing all the good stuff we are doing with Caspa, the VideoEditor, WebVfx and our new magical synchronization framework I questioned:

Why instead of using Gtk, can’t I make my ui with html and all the fancy things that are already made?

And while we are at it I want process isolation, so if the ui crashes (or I want to launch more than one to see side by side different ui styles) the video processing does not stop. Of course, should I want more tightly coupling I can embed WebKit on my application and make a javascript bridge to avoid having to use something like websockets to interact.

One can always dream…

Then my muse appeared and commanded me to type. Thankfully, mine is not like the poor soul on “Blank Page” had.

So I type, and I type, and I type.

‘Till I made this: two GStreamer pipelines, outputting to auto audio and video sinks and also to a webkit process. Buffers travel thru shared memory, still they are copied more than I’d like to but that makes things a bit easier and helps decoupling the processes, so if one stalls the others don’t care (and anyway for most of the things I want to do I’ll need to make a few copies). Lucky me I can throw beefier hardware and play with more interesting things.

I expect to release this in a couple of weeks when it’s more stable and usable, as of today it tends to crash if you stare at it a bit harder.

“It’s an act of faith, baby”

Using WebKit to display video from a GStreamer application.

Using WebKit to display video from a GStreamer application.
Something free to whoever knows who the singer is without using image search.


Using the Gstreamer Controller subsystem from Python.

This is more or less a direct translation of the examples found at gstreamer/tests/examples/controller/*.c to their equivalents using the gi bindings for Gstreamer under Python. The documentation can be found here. Reading the source also helps a lot.

The basic premise is that you can attach a controller to almost any property of an object, set an interpolation function and give it pairs of (time, value) so they are smoothly changed. I’m using a pad as a target instead of an element just because it fits my immediate needs but it really can be any Element.

First you need to import Gstreamer and initialize it:

#!/usr/bin/python
import gi
import sys
from gi.repository import GObject
gi.require_version('Gst', '1.0')
from gi.repository import Gst
from gi.repository import GstController
from gi.repository import Gtk
from gi.repository import GLib

GObject.threads_init()
Gst.init(sys.argv)

Then create your elements. This is by no means the best way but lets me cut a bit on all the boilerplate.


p = Gst.parse_launch ("""videomixer name=mix ! videoconvert ! xvimagesink
videotestsrc pattern="snow" ! videoconvert ! mix.sink_0
videotestsrc ! videoconvert ! mix.sink_1
""")

m = p.get_by_name ("mix")
s0 = [pad for pad in m.pads if pad.name == 'sink_0'][0]
s0.set_property ("xpos", 100)

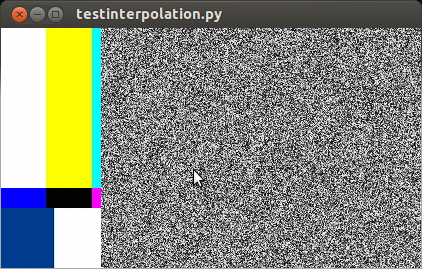
Here I created two test sources, one with bars and another with static that also has an horizontal offset. If we were to start the pipeline right now ( p.set_state (Gst.State.PLAYING) ) we would see something like this:

captura_testinterpolation

So far it works. Now I’d like to animate the alpha property of s0 (the sink pads of a videomixer have interesting properties like alpha, zorder, xpos and ypos). First we create a control source and set the interpolation mode:

cs = GstController.InterpolationControlSource()
cs.set_property('mode', GstController.InterpolationMode.LINEAR)

Then we create a control binding for the property we want to animate and add it to our element:

cb = GstController.DirectControlBinding.new(s0, 'alpha', cs)
s0.add_control_binding(cb)

It is worth noting that the same control source can be used with more than one control binding.

Now we just need to add a couple of points and play:

cs.set(0*Gst.SECOND, 1)
cs.set(4*Gst.SECOND, 0.5)
p.set_state (Gst.State.PLAYING)

If you are not running this from the interpreter remember to add GObject.MainLoop().run() , otherwise the script will end instead of keep playing. Here I’ve used absolute times, to animate in the middle of a playing state you need to get the current time and set the points accordingly, something like this will do most of the cases:


start = p.get_clock().get_time() # XXX: you better check for errors
end = start + endtime*Gst.SECOND

Avoiding too much bookkeeping

You can get the controller and control source of an element with:

control_binding = element.get_control_binding('property')
if control_binding:
    control_source = control_binding.get_property('control_source')